Satellite Imagery

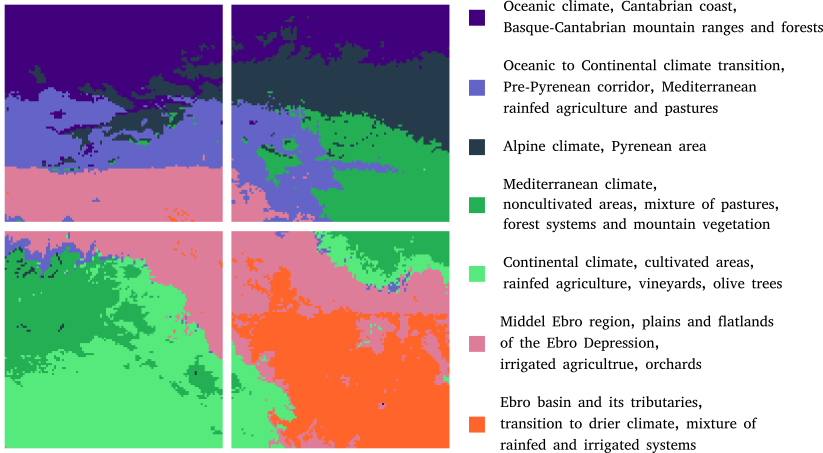
Temporal sequences of satellite images constitute a highly valuable and abundant resource for analyzing regions of interest. However, the automatic acquisition of knowledge on a large scale is a challenging task due to different factors such as the lack of precise labeled data, the definition and variability of the terrain entities, or the inherent complexity of the images and their fusion. In this context, we present a fully unsupervised and general methodology to conduct spatio-temporal taxonomies of large regions from sequences of satellite images. Our approach relies on a combination of deep embeddings and time series clustering to capture the semantic properties of the ground and its evolution over time, providing a comprehensive understanding of the region of interest. The proposed method is enhanced by a novel procedure specifically devised to refine the embedding and exploit the underlying spatio-temporal patterns. We use this methodology to conduct an in-depth analysis of a 220 km2 region in northern Spain in different settings. The results provide a broad and intuitive perspective of the land where large areas are connected in a compact and well-structured manner, mainly based on climatic, phytological, and hydrological factors.
View Full-Text. Python code available at GitHub repository
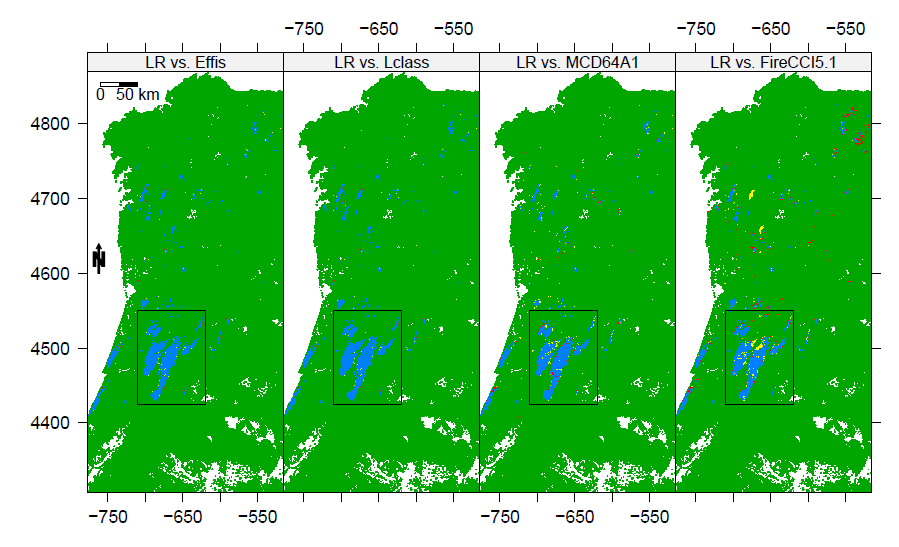
Classical statistical methods prove advantageous for small datasets, whereas machine learning algorithms can excel with larger datasets. Our paper challenges this conventional wisdom by addressing a highly significant problem: the identification of burned areas through satellite imagery, that is a clear example of imbalanced data. The methods are illustrated in the North-Central Portugal and the North-West of Spain in October 2017 within a multi-temporal setting of satellite imagery. Daily satellite images are taken from Moderate Resolution Imaging Spectroradiometer (MODIS) products. Our analysis shows that a classical Logistic regression (LR) model competes on par, if not surpasses, a widely employed machine learning algorithm called the extreme gradient boosting algorithm (XGBoost) within this particular domain.
View Full-Text. R code available at GitHub repository
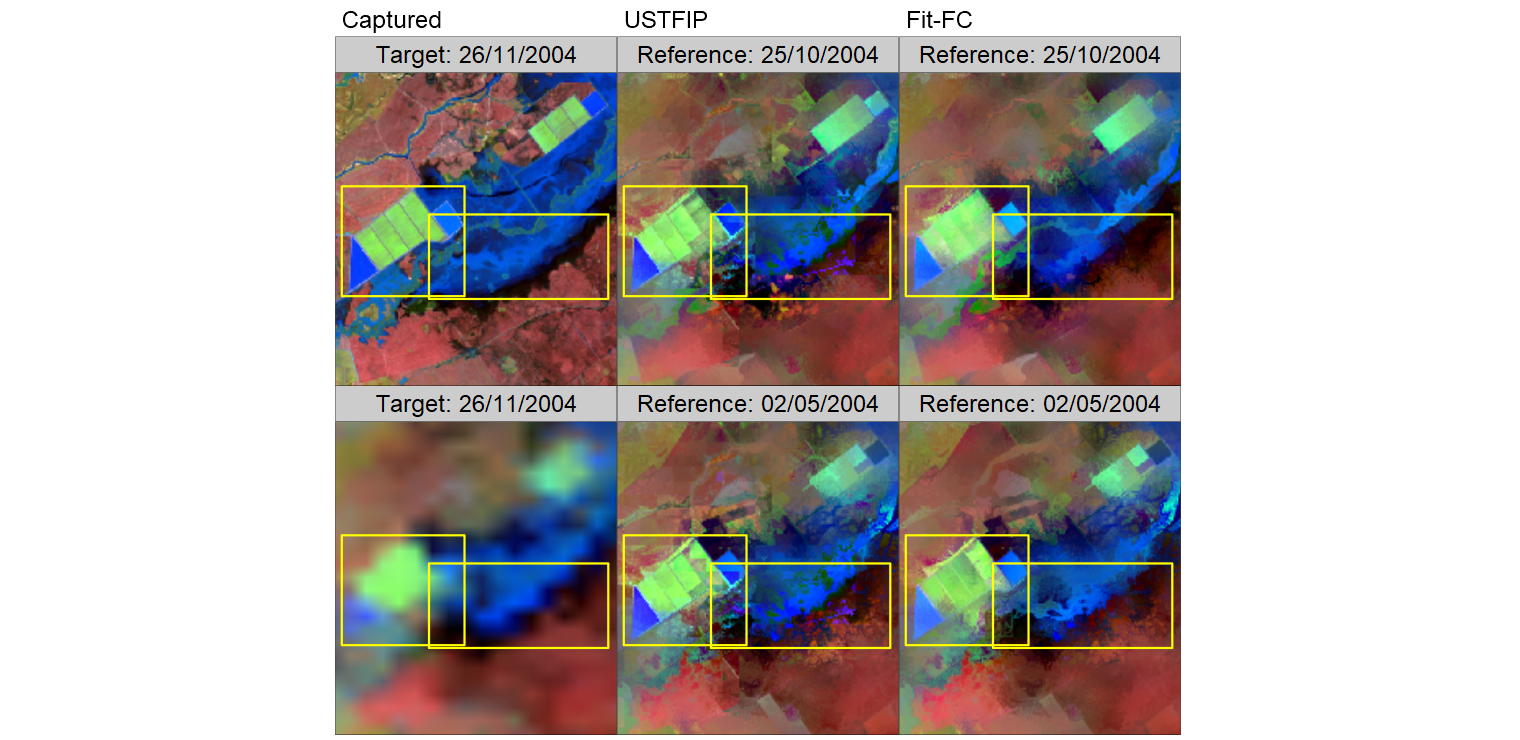
Spatio-temporal image fusion aims to increase the frequency and resolution of multispectral satellite sensor images in a cost-effective manner. However, practical constraints on input data requirements and computational cost prevent a wider adoption of these methods in real case-studies. We propose an ensemble of strategies to eliminate the need for cloud-free matching pairs of satellite sensor images. The new methodology called Unpaired Spatio-Temporal Fusion of Image Patches (USTFIP) is tested in situations where classical requirements are progressively difficult to meet. Overall, the study shows that USTFIP reduces the root mean square error by 2-to-13% relative to the state-of-the-art Fit-FC fusion method, due to an efficient use of the available information. Implementation of USTFIP through parallel computing saves up to 40% of the computational time required for Fit-FC.
View Full-Text (open access).
With this work, we are currently building an image processing platform. View the project that has been awarded for this specific objective.
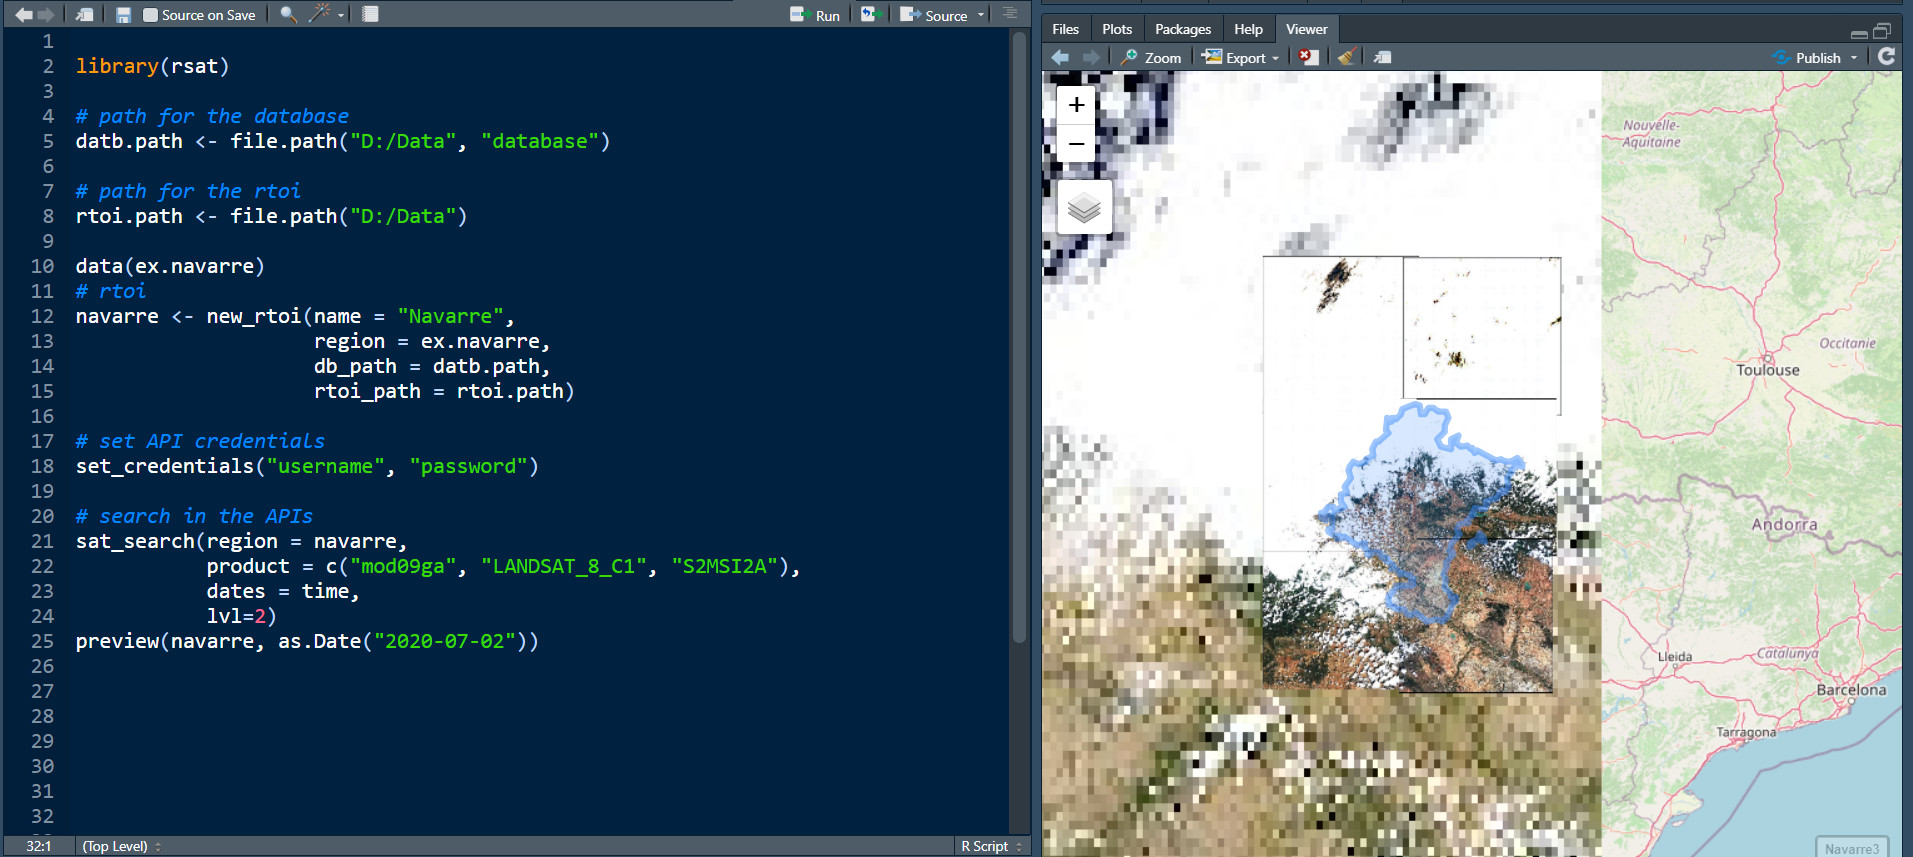
This package aims for downloading, processing, and smoothing time series of satellite images from Landsat, MODIS and Sentinel satellite programs in a uniform and standardized way. It is an inprovement over RGISTools that introduces new R classes to ease the management of the data and extract a processed version of the images in raster or stars classes.
Install the last version from GitHub Here
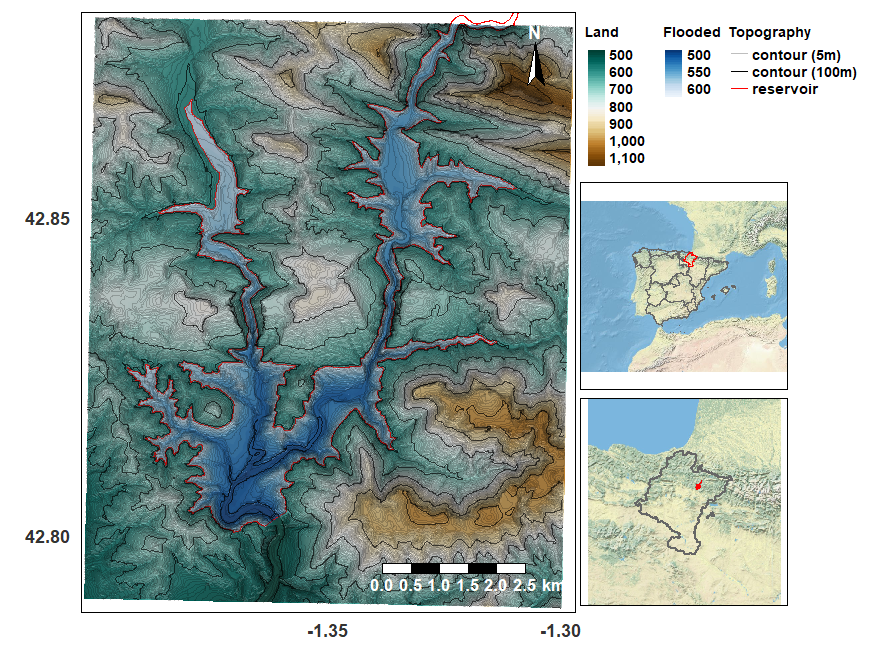
This manuscript introduces RGISTools, a new software that solves these issues, and provides a working example on water mapping, which is a socially and environmentally relevant research field. The case study uses a digital elevation model and a rarely assessed combination of Landsat-8 and Sentinel-2 imagery to determine the water level of a reservoir in Northern Spain. The case study demonstrates how to acquire and process time series of surface reflectance data in an efficient manner. The case study demonstrates how to acquire and process time series of surface reflectance data in an efficient manner. Our method achieves reasonably accurate results, with a root mean squared error of 0 . 90 m. Future improvements of the package involve the expansion of the workflow to cover the processing of radar images. This should counteract the limitation of the cloud coverage with multi-spectral images.
View Full-Text (open access)
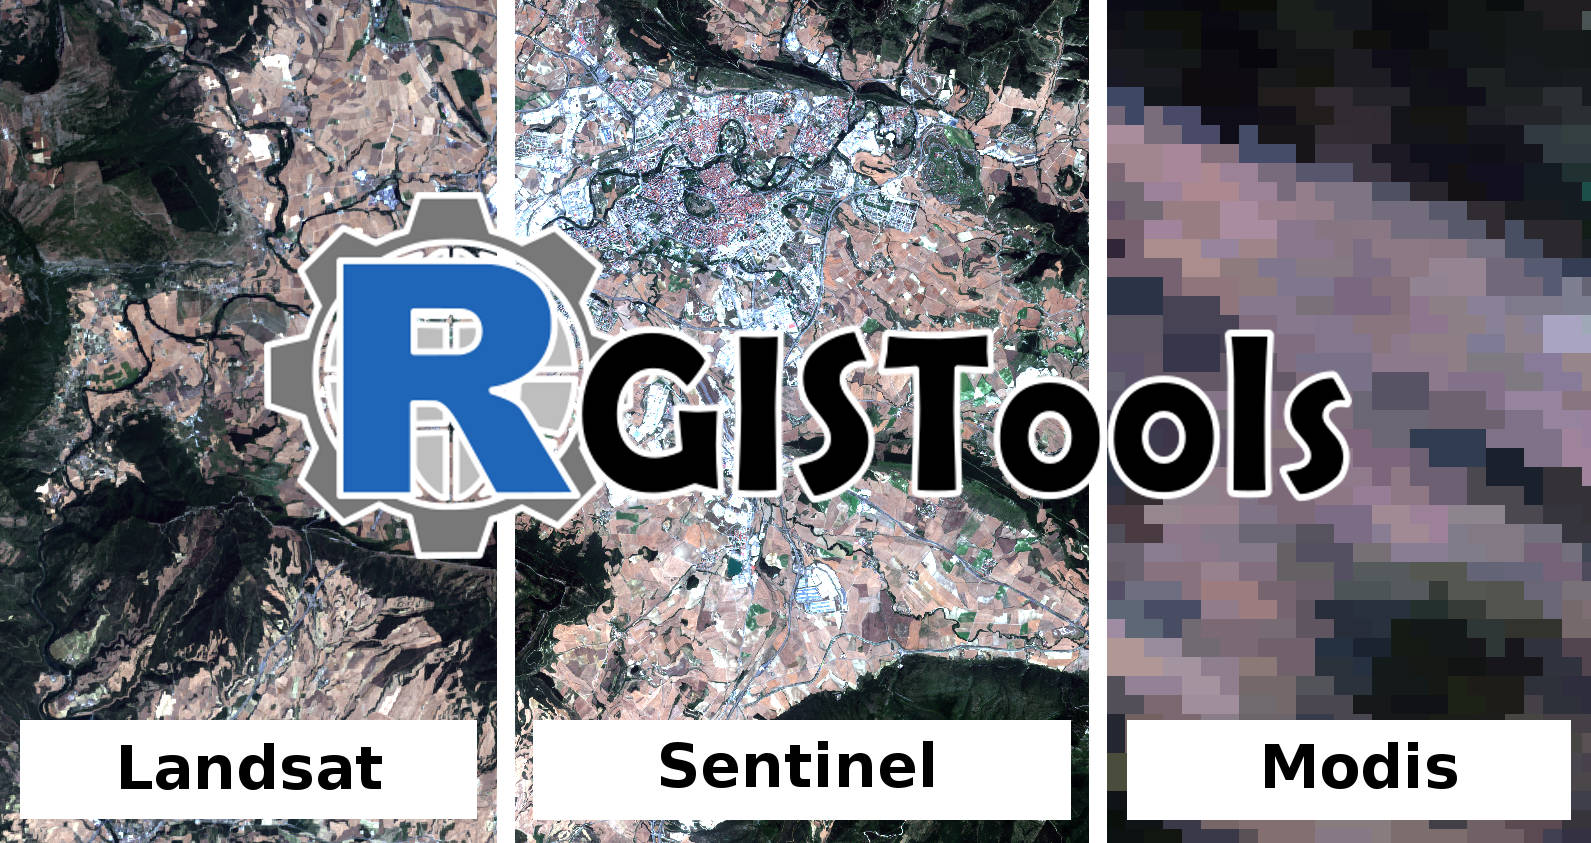
This package aims for downloading, processing, and smoothing time series of satellite images from Landsat, MODIS and Sentinel satellite programs in a uniform and standardized way. The functions of RGISTools automatically convert the original formats into .tif files, which can be loaded into R. The processing functions of RGISTools include tile mosaicking, cropping, and extracting the variables of interest. When multiple tile match the region of interest, RGISTools combines them to generate a single image and crops the area of interest to save memory and computing time. All images available in a range of dates are then stacked to produce time series of satellite images for a particular area. Images may have clouds or measurement errors that limit their use in subsequent analyses. Hence, the package includes a set of functions for removing clouds, gap filling and smoothing. Due to the wide variety of procedures and sources of information being handled in RGISTools, the functions are divided into 6 categories, which are identified by the first 3 characters of the function names; (1) mod –for MODIS Terra and Aqua satellite images, (2) sen – for Sentinel images, (3) ls7 - for Landsat 7 images, (4) ls8 – for Landsat 8 images, (5) ls – for both Landsat 7 and 8 images, (6) gen – for any of the three platforms.
Find the package in GitHub
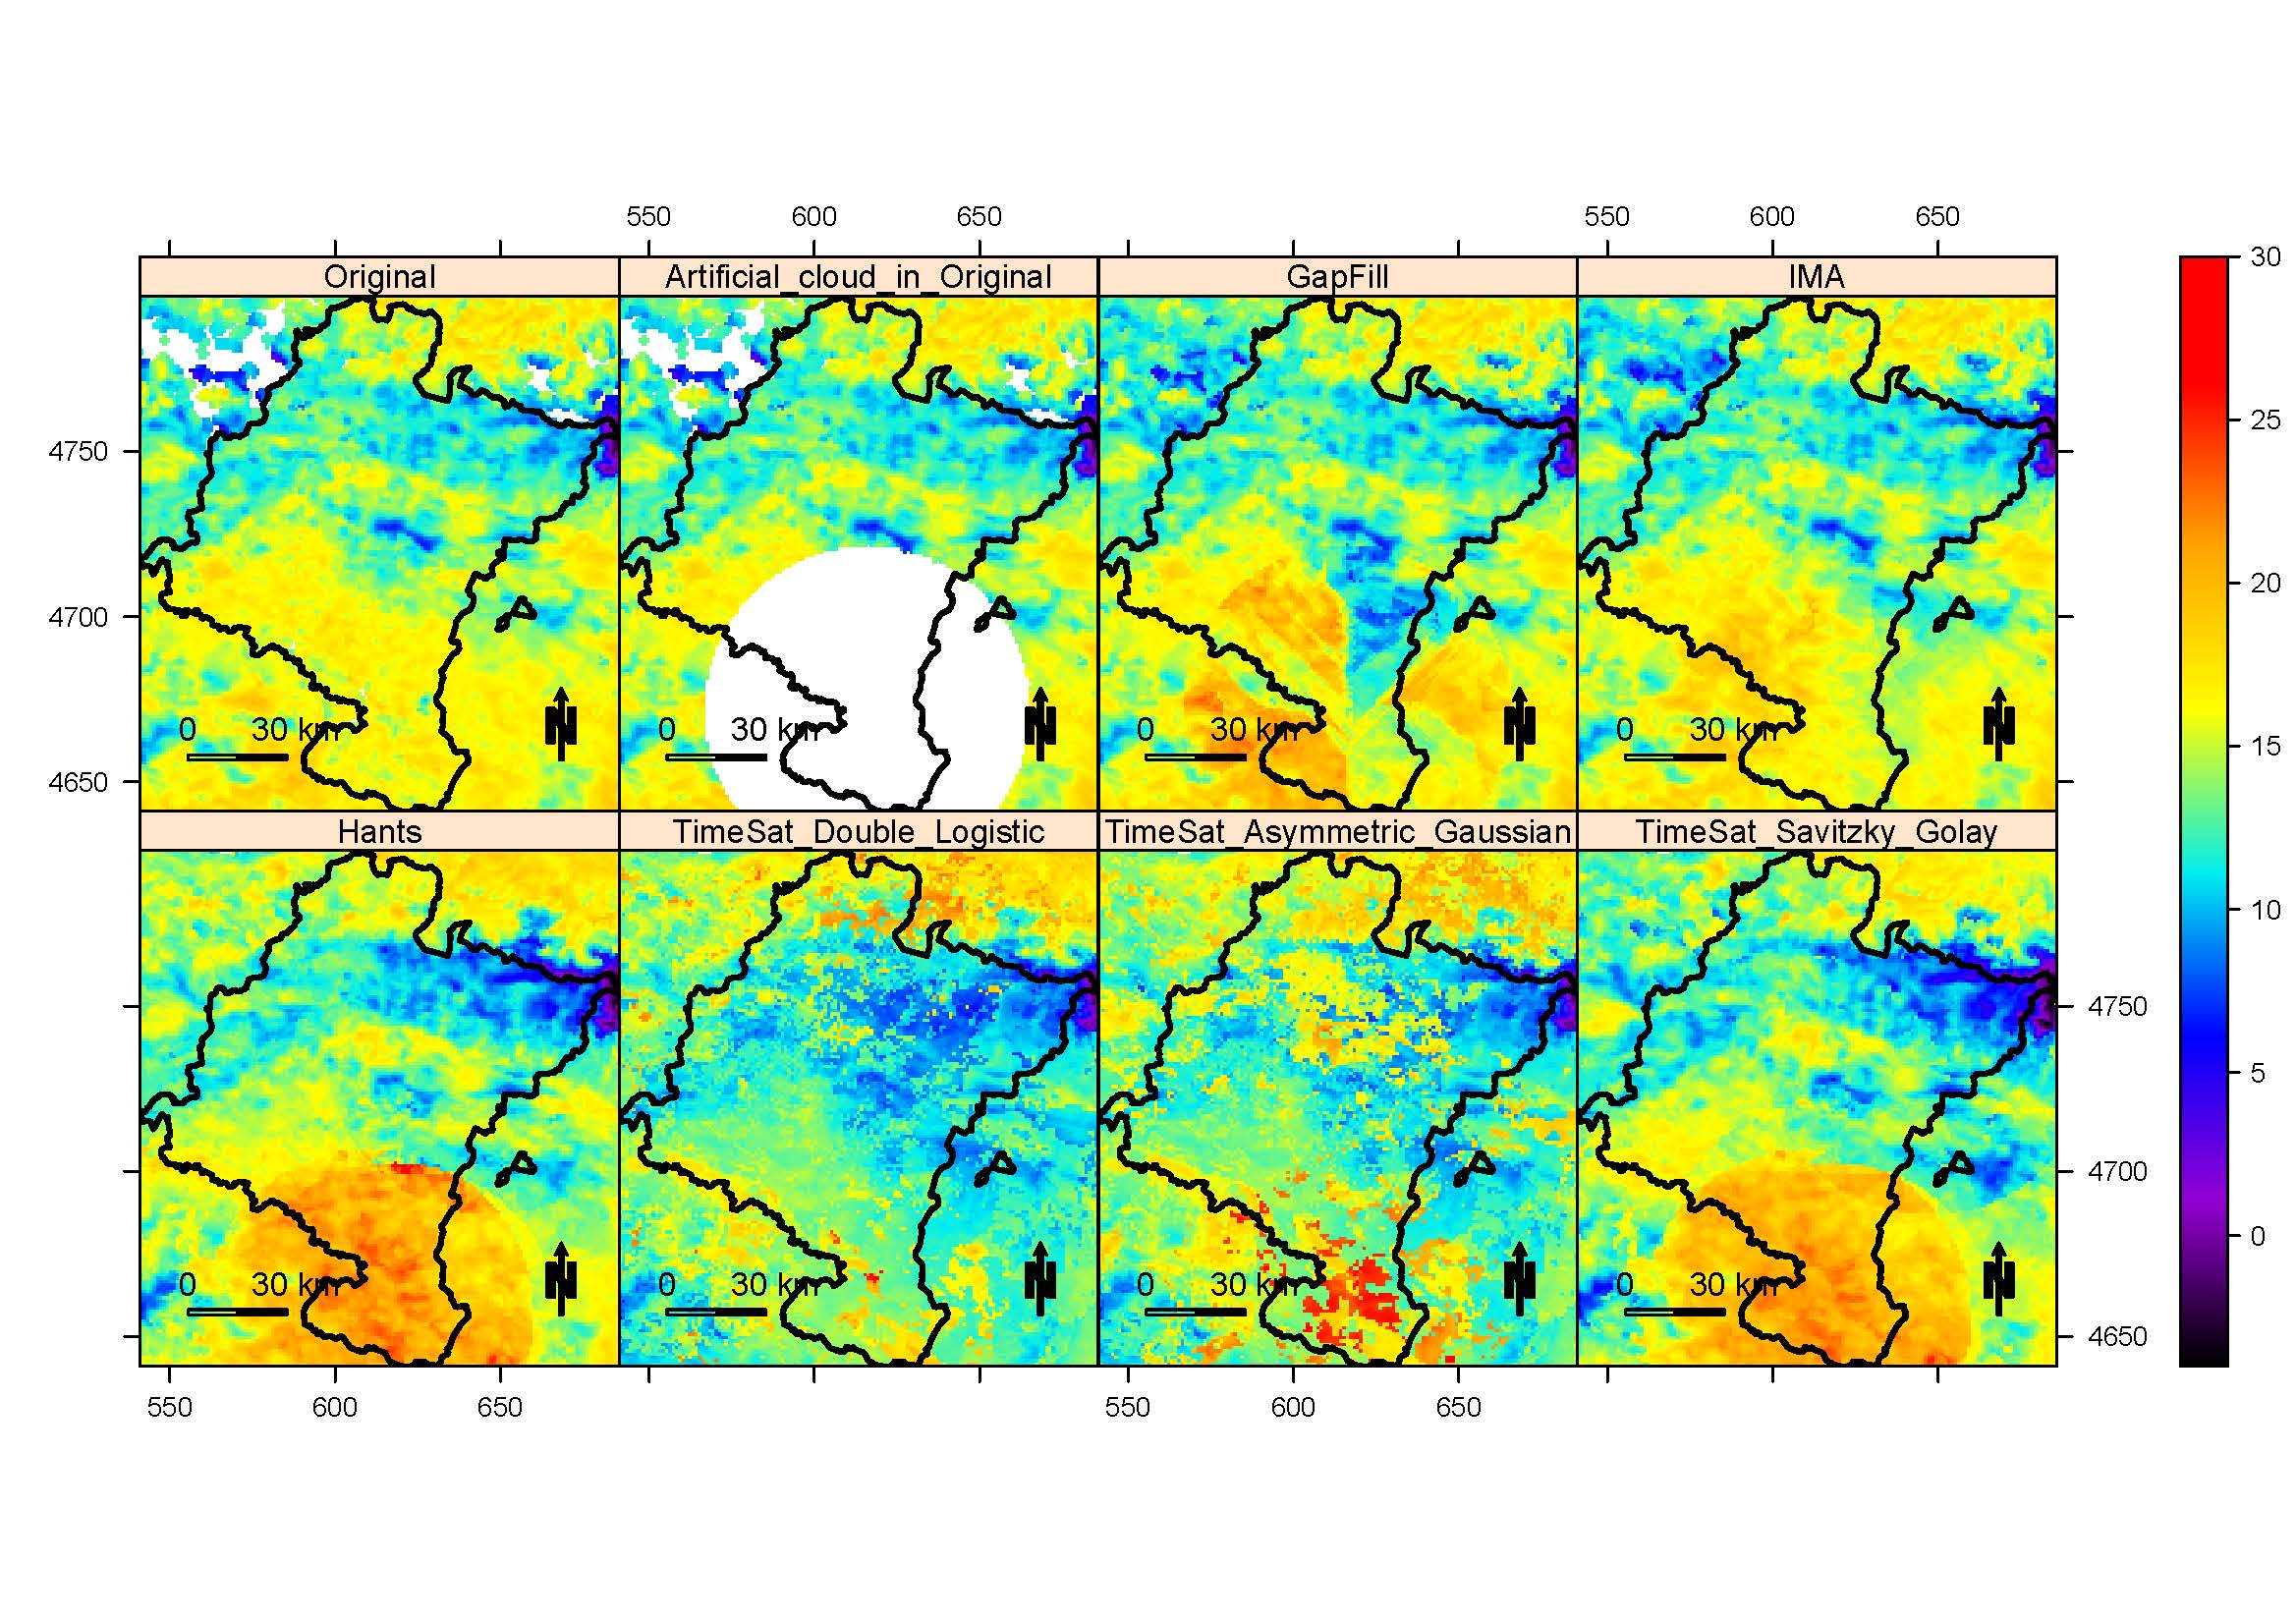
When monitoring time series of remote sensing data, it is advisable to fill gaps, i.e., missing or distorted data, caused by atmospheric effects or technical failures. In this paper, a new method for filling these gaps called interpolation of the mean anomalies (IMA) is proposed and compared with some competitors. The method consists of: 1) defining a neighborhood for the target image from previous and subsequent images across previous and subsequent years; 2) computing the mean target image of the neighborhood; 3) estimating the anomalies in the target image by subtracting the mean image from the target image; 4) filtering the anomalies; 5) averaging the anomalies over a predefined window; 6) interpolating the averaged anomalies; and 7) adding the interpolated anomalies to the mean image. To assess the performance of the IMA method, both a real example and a simulation study are conducted with a time series of Moderate Resolution Imaging Spectroradiometer (MODIS) TERRA and MODIS AQUA images captured over the region of Navarre (Spain) from 2011 to 2013. We analyze the land surface temperature (LST) day and night, and the normalized difference vegetation index (NDVI). In the simulation study, seven sizes of artificial clouds are randomly introduced to each image in the studied time series. The square root of the mean-squared prediction error (RMSE) between the original and the filled data is chosen as an indicator of the goodness of fit. The results show that the IMA method outperforms Timesat, Hants, and Gapfill (GF) in filling small, moderate, and big cloud gaps in both the day and night LST and NDVI data, reaching RMSE reductions of up to 23%.
View Full-Text (open access)
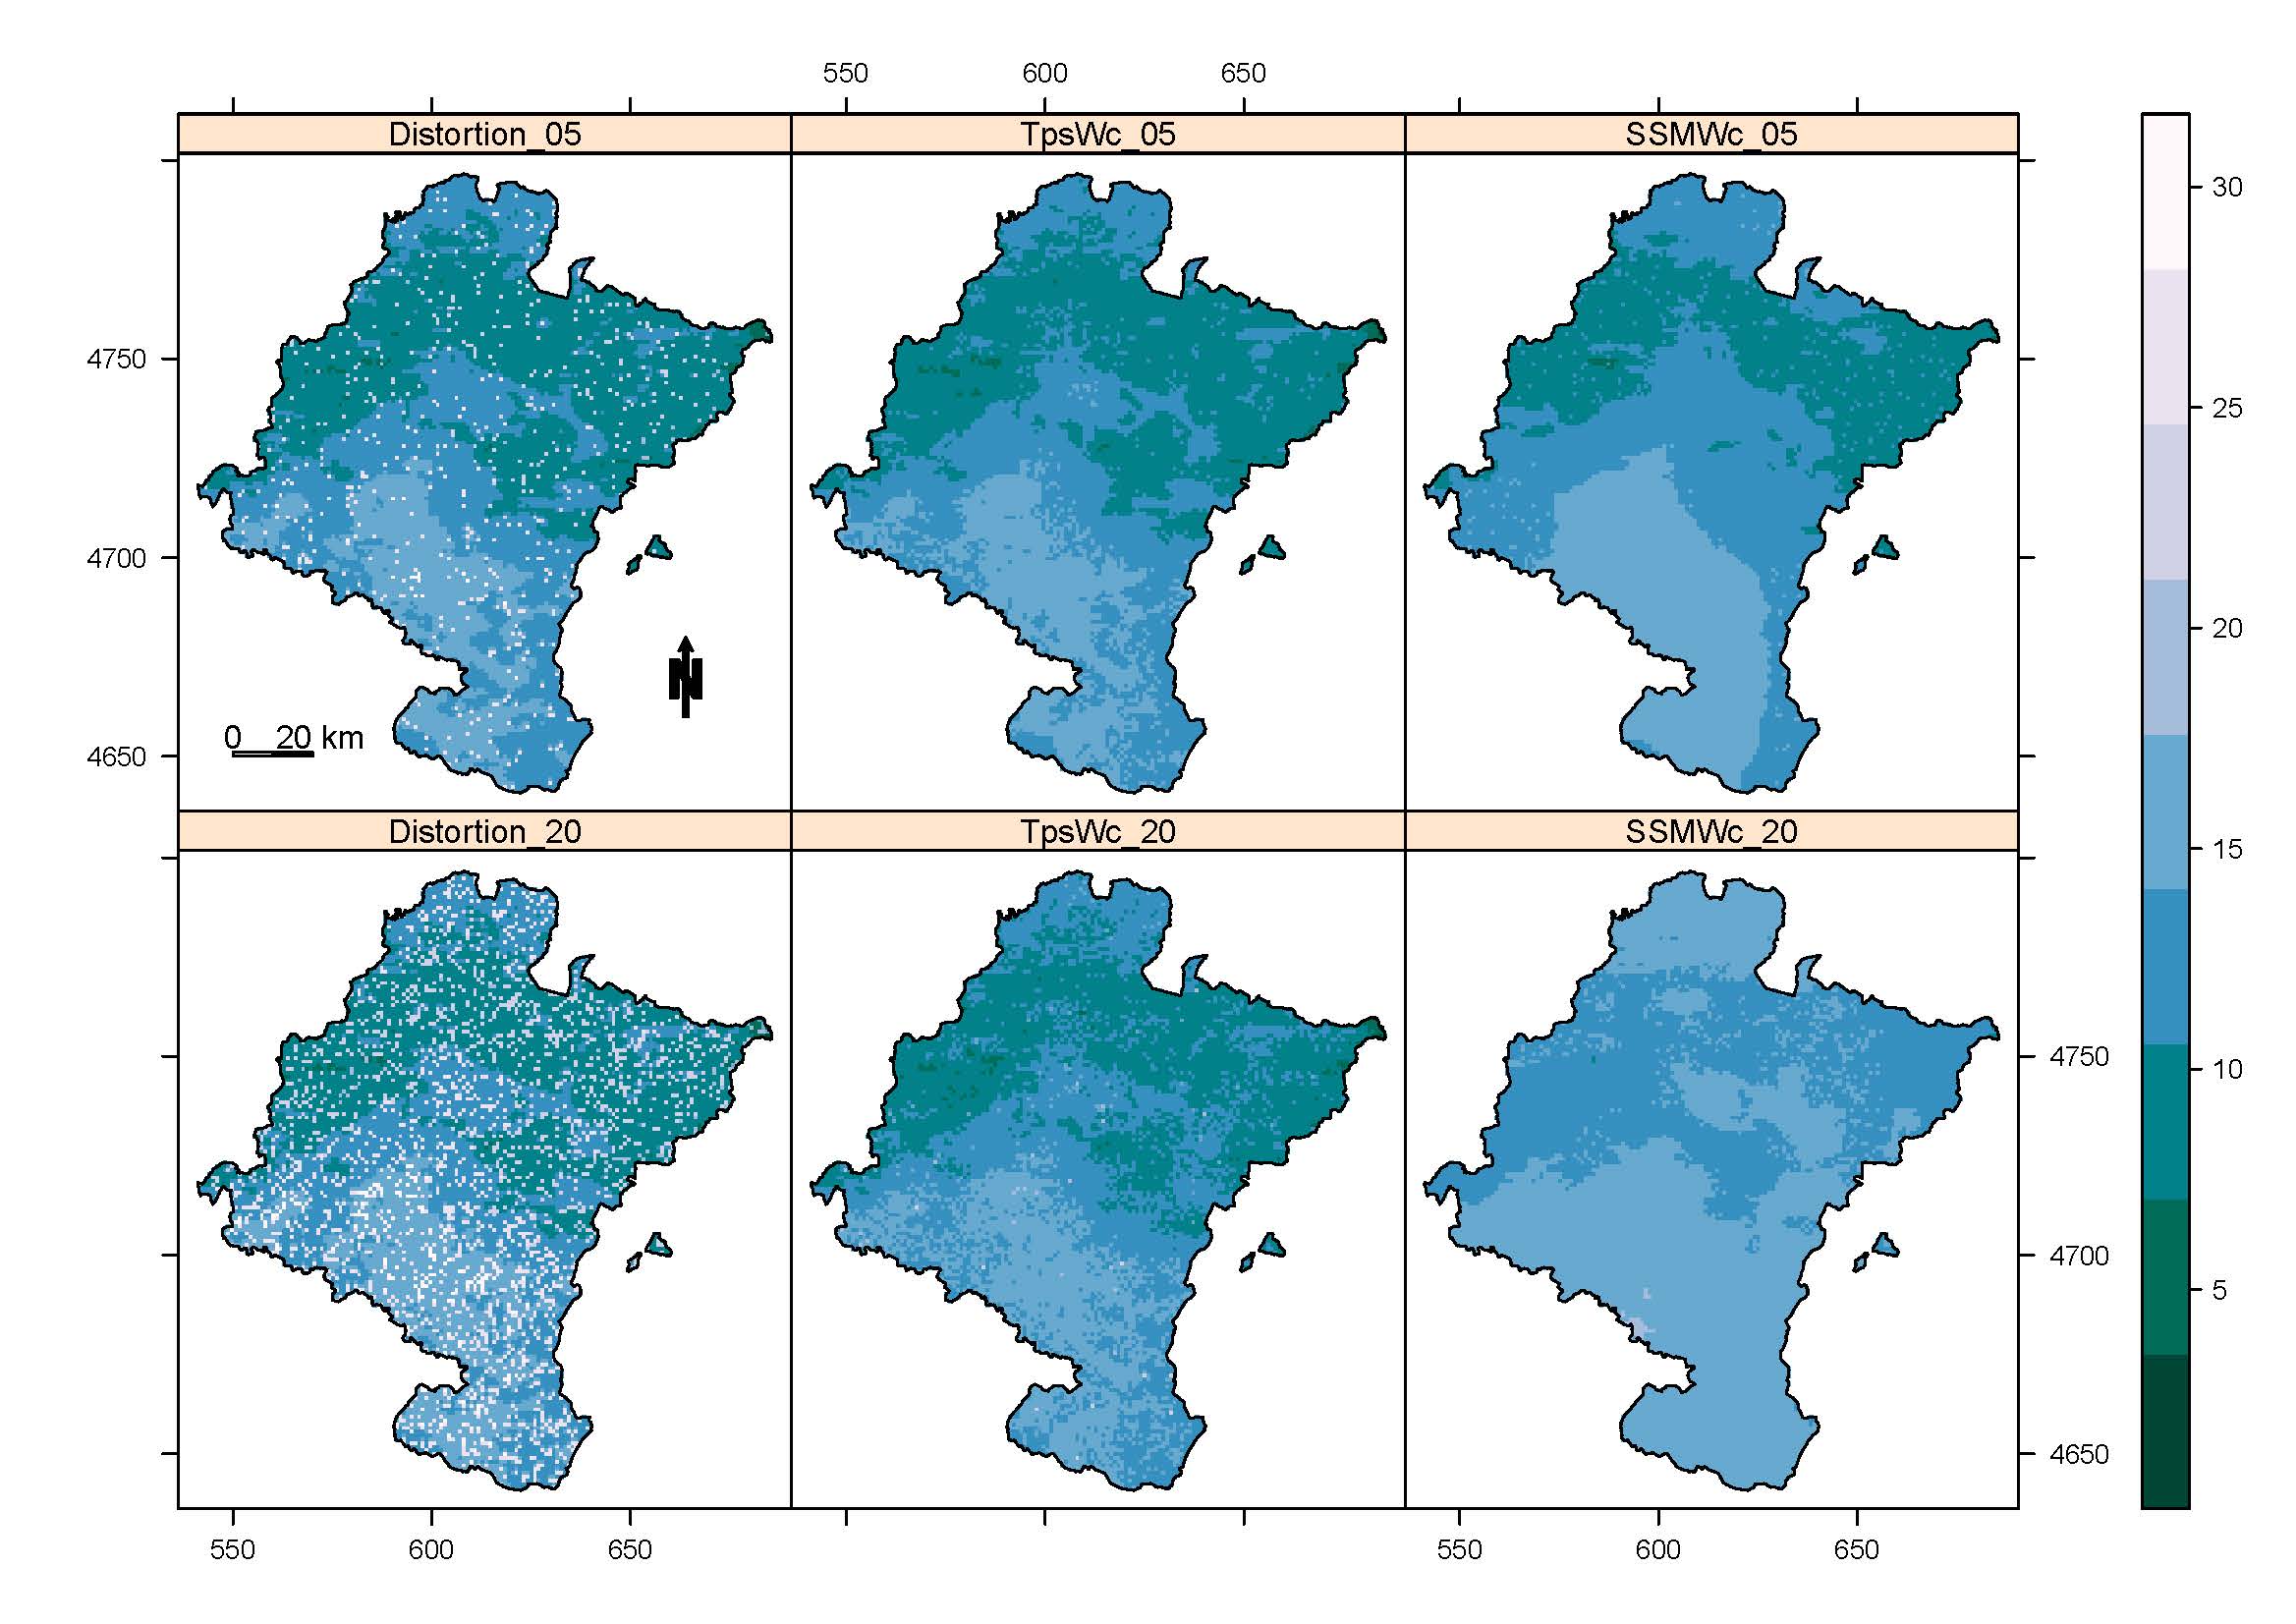
Multitemporal imagery is by and large geometrically and radiometrically accurate, but the residual noise arising from removal clouds and other atmospheric and electronic effects can produce outliers that must be mitigated to properly exploit the remote sensing information. In this study, we show how ground-truth data from rain gauge stations can improve the quality of satellite imagery. To this end, a simulation study is conducted wherein different sizes of outlier outbreaks are spread and randomly introduced in the normalized difference vegetation index (NDVI) and the day and night land surface temperature (LST) of composite images from Navarre (Spain) between 2011 and 2015. To remove outliers, a new method called thin-plate splines with covariates (TpsWc) is proposed. This method consists of smoothing the median anomalies with a thin-plate spline model, whereby transformed ground-truth data are the external covariates of the model. The performance of the proposed method is measured with the square root of the mean square error (RMSE), calculated as the root of the pixel-by-pixel mean square differences between the original data and the predicted data with the TpsWc model and with a state-space model with and without covariates. The study shows that the use of ground-truth data reduces the RMSE in both the TpsWc model and the state-space model used for comparison purposes. The new method successfully removes the abnormal data while preserving the phenology of the raw data. The RMSE reduction percentage varies according to the derived variables (NDVI or LST), but reductions of up to 20% are achieved with the new proposal.
View Full-Text (open access)
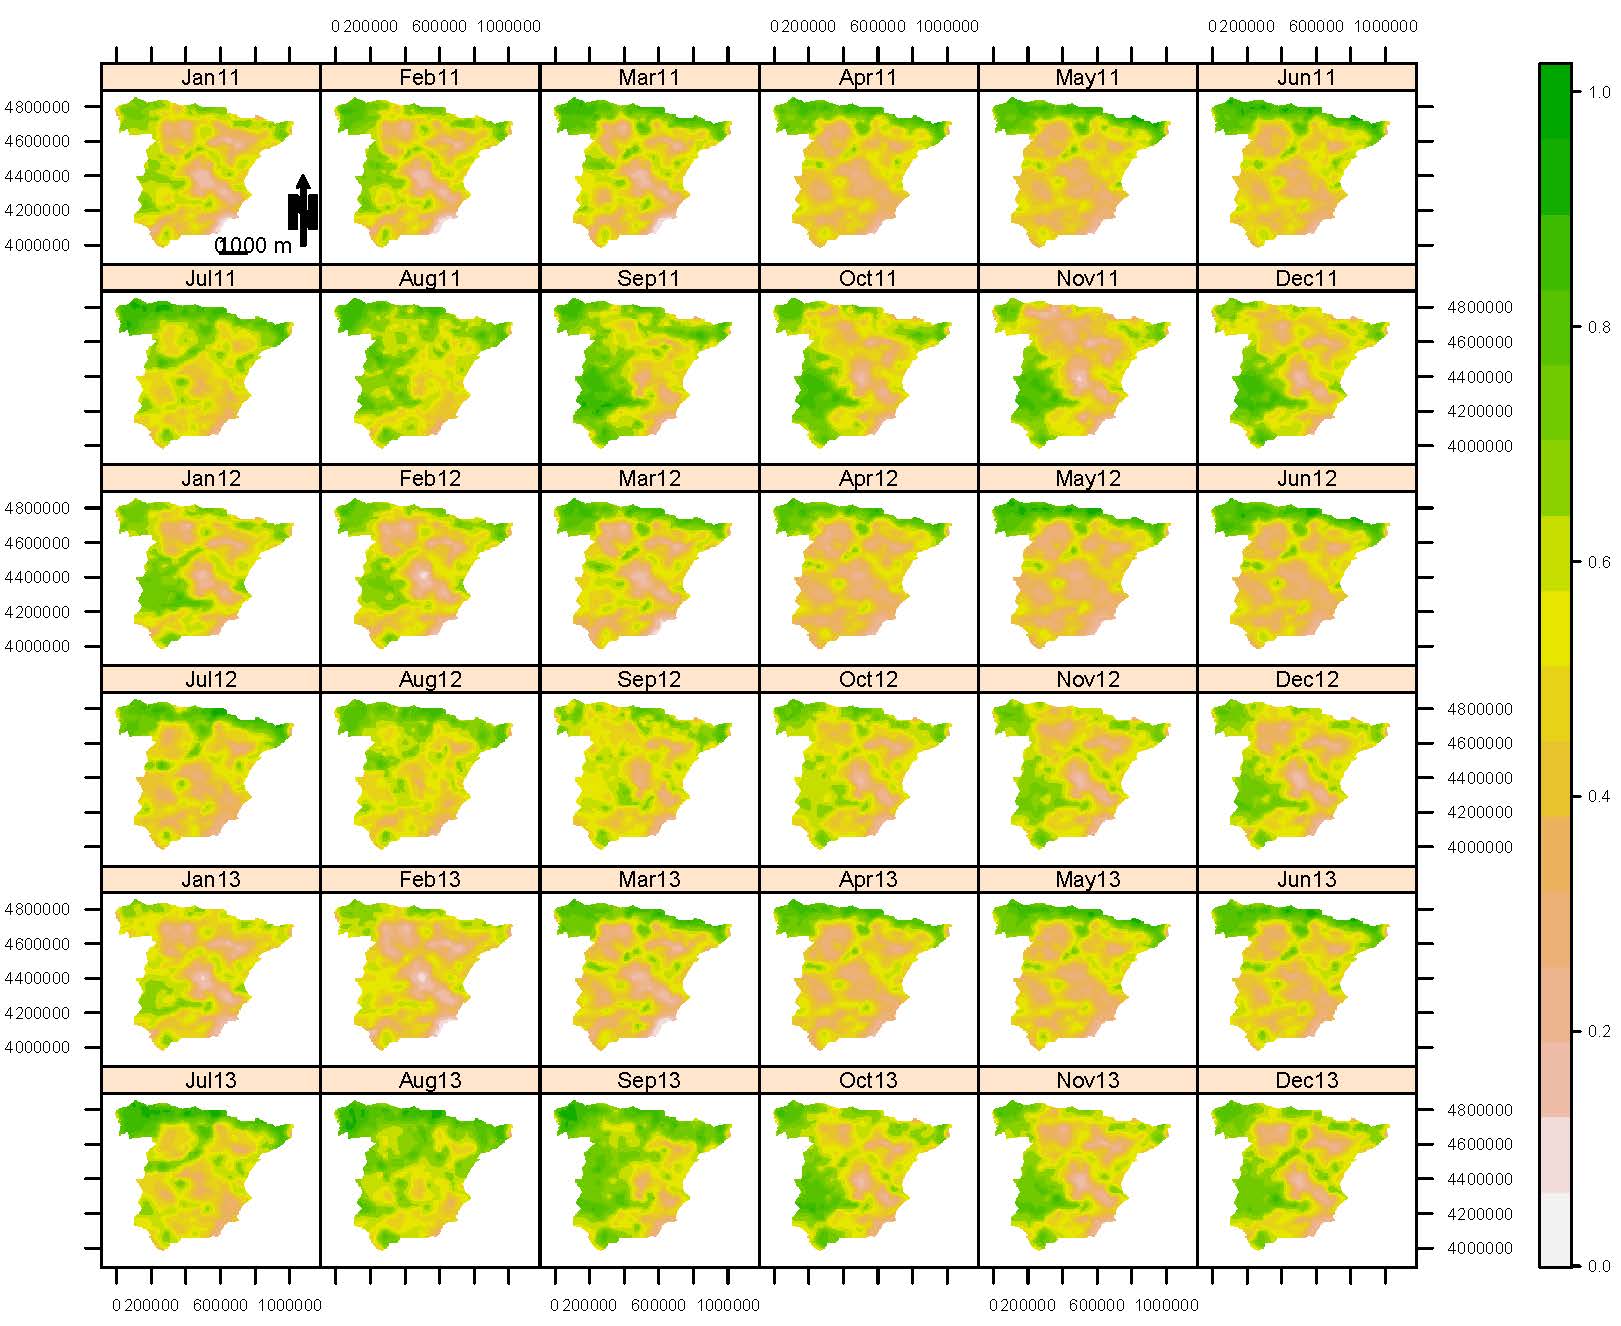
The normalized difference vegetation index (NDVI) is an important indicator for evaluating vegetation change, monitoring land surface fluxes or predicting crop models. Due to the great availability of images provided by different satellites in recent years, much attention has been devoted to testing trend changes with a time series of NDVI individual pixels. However, the spatial dependence inherent in these data is usually lost unless global scales are analyzed. In this paper, we propose incorporating both the spatial and the temporal dependence among pixels using a stochastic spatio-temporal model for estimating the NDVI distribution thoroughly. The stochastic model is a state-space model that uses meteorological data of the Climatic Research Unit (CRU TS3. 10) as auxiliary information. The model will be estimated with the Expectation-Maximization (EM) algorithm. The result is a set of smoothed images providing an overall analysis of the NDVI distribution across space and time, where fluctuations generated by atmospheric disturbances, fire events, land-use/cover changes or engineering problems from image capture are treated as random fluctuations. The illustration is carried out with the third generation of NDVI images, termed NDVI3g, of the Global Inventory Modeling and Mapping Studies (GIMMS) in continental Spain. This data are taken in bymonthly periods from January 2011 to December 2013, but the model can be applied to many other variables, countries or regions with different resolutions.
View Full-Text (open access)